



US Treasury Bonds: Higher Yields, Income, and the Trade-Off for Growth

An accessible guide to 2-, 5-, 10-, 20-, and 30-year Treasuries, with historical yield charts, calculated bond-price examples, and a balanced look at income, risk, and growth.
Earning meaningful interest on money you want to preserve is appealing. U.S. Treasuries offer a straightforward bargain: lend to the federal government and receive specified payments. The harder question is what you give up for that greater predictability, especially when the money might otherwise be invested for growth.
First, distinguish prices from yields. Higher market yields generally mean lower prices for existing fixed-rate bonds. Today's Treasury yields are substantially above their 2010s averages, but calling them historical highs would be wrong. The early 1980s were a very different interest-rate world.
Terminology helps: two-, five-, and ten-year issues are Treasury notes; 20- and 30-year issues are Treasury bonds. Bills mature in a year or less and generally earn interest through the difference between purchase price and face value. Here, “Treasuries” is the umbrella term. Notes and bonds pay coupons every six months. TreasuryDirect explains the distinctions.
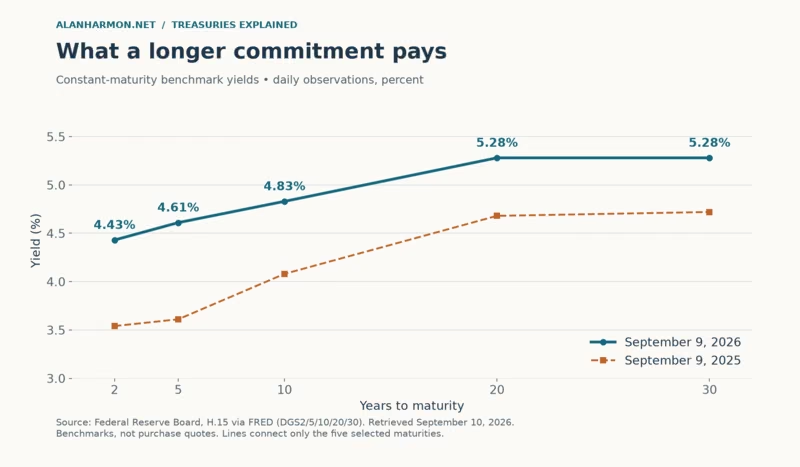
Data as of September 9, 2026; researched September 10. This is the latest common daily observation in the downloaded Federal Reserve series. These constant-maturity yields are market benchmarks, not auction coupons or guaranteed purchase quotes.
| Maturity | Sep. 9, 2026 | Sep. 9, 2025 | 2010–2019 monthly average |
|---|---|---|---|
| 2 years | 4.43% | 3.54% | 0.96% |
| 5 years | 4.61% | 3.61% | 1.65% |
| 10 years | 4.83% | 4.08% | 2.41% |
| 20 years | 5.28% | 4.68% | 2.92% |
| 30 years | 5.28% | 4.72% | 3.19% |
The 2010s column averages 120 monthly observations, January 2010–December 2019; the other columns are individual days. Sources: Federal Reserve H.15 and the linked FRED series. The curve below connects five selected maturities. Longer terms do not always pay more: curves can slope downward or have a hump.
Treasury yields: now and one year earlier
Two years: income with a shorter commitment
A two-year Treasury can help match a known spending date without committing principal for decades. Its price normally reacts less to changing yields than a longer security with a similar coupon. That makes the maturity useful to consider when timing matters, although a sale before maturity can still produce a loss.
The trade-off arrives relatively soon: what happens when it matures? If prevailing rates have fallen, rolling the proceeds into another Treasury may produce less income. That is reinvestment risk. Buying a short maturity repeatedly is a different strategy from fixing a longer stream of payments today.
The two-year yield responds strongly to expectations about Federal Reserve policy over the next several years. It is a market yield, however, and does not equal the Fed's overnight policy rate.
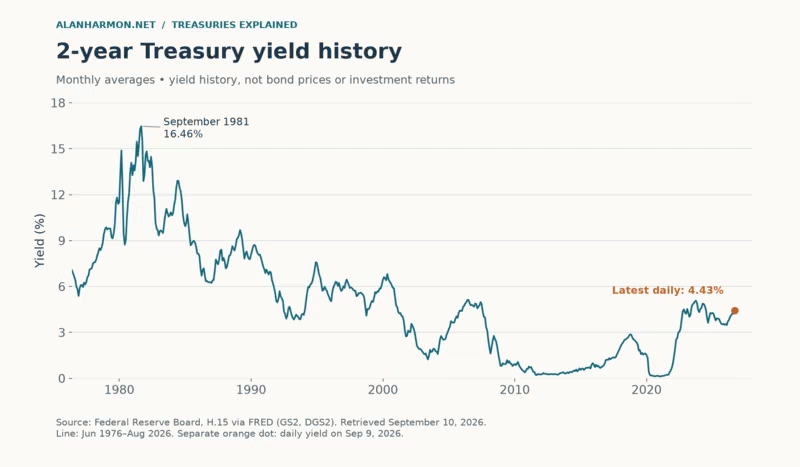
The monthly history beginning in June 1976 reached 16.46% in September 1981. Its 2020–2021 low was 0.12% in February 2021, while its highest monthly average since January 2022 was 5.07% in October 2023. September 9's daily 4.43% looks meaningful beside the low-rate era, not unprecedented beside the full history.
2-year Treasury yield history
Five years: the middle ground
A five-year note extends the income commitment while retaining an earlier repayment date than the ten-, 20-, or 30-year alternatives. It reduces how soon principal must be reinvested, in exchange for more market-price sensitivity than a comparable two-year note.
Suppose money is intended for a purchase roughly five years away. A maturity near that date can connect the investment to its purpose. Rolling shorter Treasuries could turn out better if future rates rise, or worse if they fall. Neither outcome is known at purchase, and five years is not automatically everyone's ideal compromise.
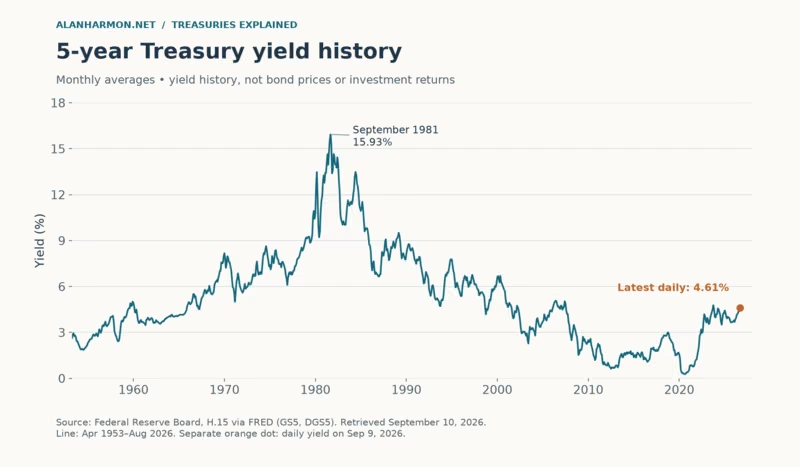
The five-year monthly series starts in April 1953 and peaked at 15.93% in September 1981. Its pandemic-period low was 0.27% in August 2020; its January 2022–August 2026 high was 4.77% in October 2023. The chart shows both the long decline from the 1980s and the later rebound. September 9's daily 4.61% is a separate observation, not an extra monthly average.
5-year Treasury yield history
Ten years: the benchmark people hear about
The ten-year Treasury is a widely followed reference for longer-term financing. Mortgage rates are influenced by Treasury yields, but they also reflect mortgage-specific risks, costs, and market conditions. A 4.83% Treasury benchmark does not mean a borrower can get a 4.83% mortgage.
Longer yields reflect expectations about future short-term rates and compensation for bearing interest-rate risk, often called the term premium. Inflation expectations, growth prospects, Treasury supply, and investor demand can influence those components. The New York Fed's explanation emphasizes that the term premium must be estimated rather than directly observed.
This is why a Fed rate cut need not bring lower long-term yields. The market might already anticipate the cut, while revising future inflation or risk compensation upward. That is a possible mechanism, not a forecast of the next policy decision.
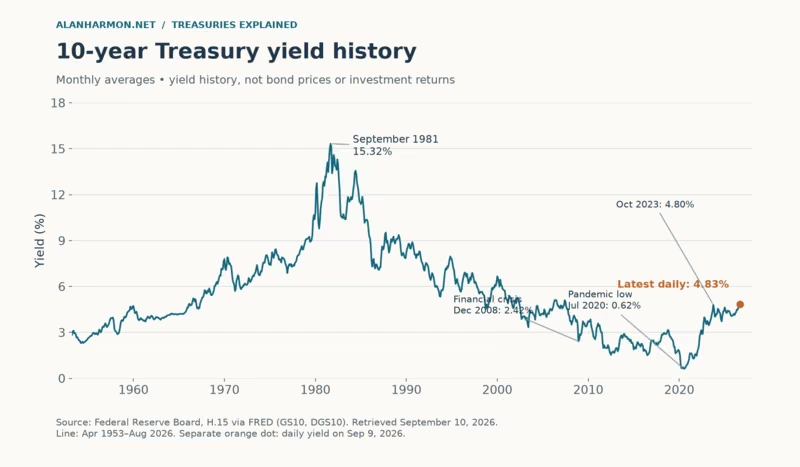
The monthly series from April 1953 peaked at 15.32% in September 1981. It averaged 2.42% in December 2008 and fell to 0.62% in July 2020 before reaching 4.80% in October 2023, the highest monthly average in January 2022–August 2026. The latest daily 4.83% is near that recent level, still far below the early-1980s peak.
10-year Treasury yield history
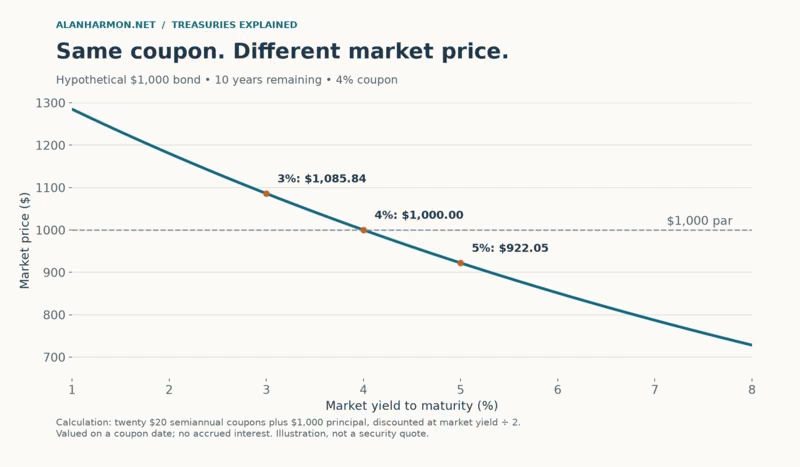
Same coupon, different price
Consider a hypothetical bond with $1,000 face value, ten years remaining, and a 4% annual coupon paid semiannually. Its face value is the amount due at maturity. Its coupon is $40 a year, delivered as two $20 payments. Its market price is what someone pays for those remaining payments today.
Yield to maturity is the discount rate that makes the value of the remaining promised payments equal the purchase price. It incorporates the coupon and the difference between price and maturity value. Current yield is simpler: annual coupon divided by purchase price. The measures answer different questions. FINRA explains these yield measures.
| Market yield | Price | Annual coupon |
|---|---|---|
| 3% | $1,085.84 | $40.00 |
| 4% | $1,000.00 | $40.00 |
| 5% | $922.05 | $40.00 |
Every figure is hypothetical. The calculation discounts twenty $20 payments and the final $1,000 at half the annual yield per six-month period, on a coupon date with no accrued interest. At a 3% required yield, the existing 4% coupon is worth a premium. At 5%, the same payments sell at a discount. Nothing changes the $40 annual coupon.
As maturity approaches, a plain fixed-rate bond's price tends toward face value, assuming payment occurs as promised. Holding to maturity avoids having to realize an interim price decline, but repayment is face value, not necessarily what a premium buyer paid. Inflation and opportunity cost remain. So does coupon reinvestment: yield to maturity is not a promise of the compound return an investor ultimately earns if coupons are spent or reinvested at different rates.
How yield changes a bond’s price
Twenty years: a longer promise with more price exposure
A 20-year Treasury fixes income for much longer, but its distant payments make its price more sensitive to changing yields than a comparable shorter security. A large price swing is possible even when confidence in repayment remains strong.
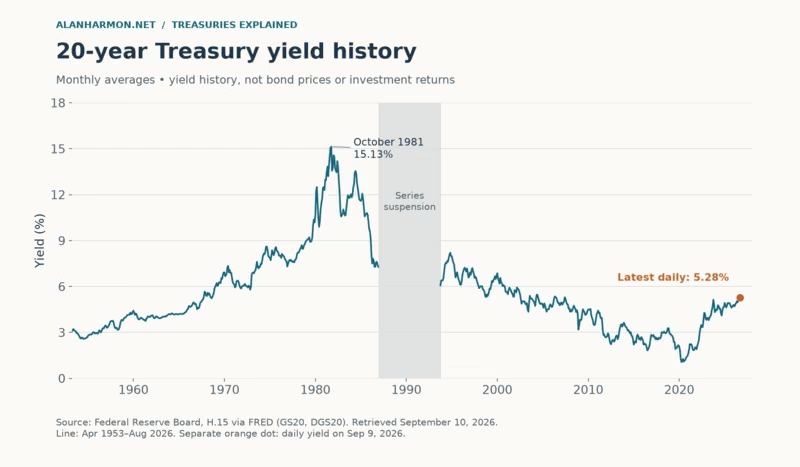
The monthly history begins in April 1953, with a documented gap from January 1987 through September 1993. A constant-maturity series estimates the yield at a fixed remaining term; it is not the price history of one bond held throughout the chart.
Separately, regular new 20-year issues were eliminated in 1986 and reintroduced in May 2020, according to Treasury's timeline. A new-issue interruption and a benchmark-series gap are different things. Neither means every outstanding Treasury bond disappeared.
The monthly high was 15.13% in October 1981; the 2020–2021 low was 1.06% in April 2020. August 2026's 5.22% was the highest monthly average since January 2022. The latest daily reading is 5.28%. Differences in issuance, liquidity, and demand at particular maturities can make a 20-year yield exceed a 30-year yield; the two happen to be equal in this snapshot.
20-year Treasury yield history
Thirty years: income for decades is not cash
A 30-year Treasury can suit a liability far in the future or a desire for long-lasting nominal income. Its low credit risk does not make its market value stable. A buyer who might need the money next year should understand how much a yield change can move today's price.
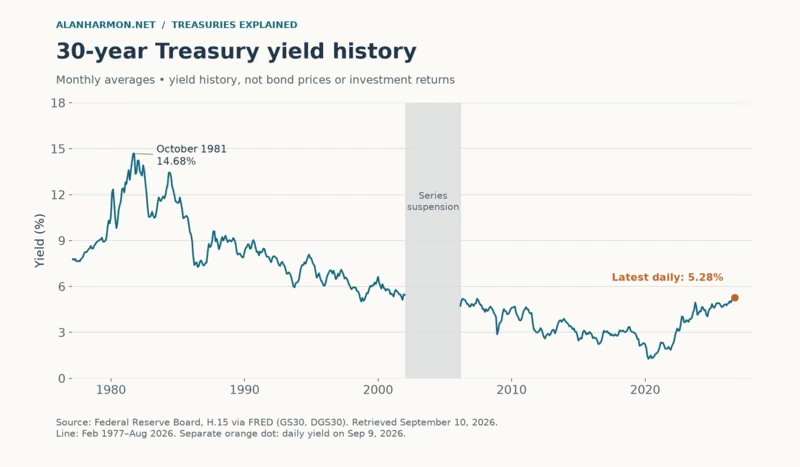
The monthly history from February 1977 reached 14.68% in October 1981 and a pandemic-period low of 1.27% in April 2020. August 2026's 5.22% was its highest monthly average in January 2022–August 2026. September 9's daily yield is 5.28%; none of those observations predicts the next price move.
The source notes document a benchmark suspension from February 18, 2002 to February 9, 2006. That interval is left blank, with the boundary months also omitted from the monthly plot. Values supplied in the downloaded file during the suspension are not used because their methodology was not established.
Here is the maturity trade-off in dollars-and-cents terms. Each hypothetical security starts at $1,000 par with the same 4% coupon. These are exact immediate price changes when the yield moves to 3% or 5%, with semiannual payments, no elapsed time, and no accrued interest.
| Years remaining | Yield falls to 3% | Yield rises to 5% |
|---|---|---|
| 2 | +1.93% | -1.88% |
| 5 | +4.61% | -4.38% |
| 10 | +8.58% | -7.79% |
| 20 | +14.96% | -12.55% |
| 30 | +19.69% | -15.45% |
The 30-year example loses about 15.45% when the yield rises one percentage point, versus 1.88% for the two-year example. A yield decline produces gains, and the gain and loss are not perfectly symmetrical. These are price changes only, not a year's total returns.
30-year Treasury yield history
What Treasuries can do for a portfolio
Separate four questions: Will the issuer pay? What price could I sell for? What will the payments buy? Can I sell when needed? Those are credit, price, purchasing-power, and liquidity risks. Treasuries have relatively low credit risk and a large secondary market, but selling still involves prevailing prices and trading costs.
For an individual fixed-rate Treasury, the nominal coupon and maturity payments are specified. Matching a maturity to planned spending may reduce the need to sell stocks during a downturn. Diversification can also reduce portfolio volatility in some conditions, but stocks and bonds can fall together when rising inflation or discount rates hurt both. This Federal Reserve discussion explains why their relationship can change.
A simple hypothetical ladder might divide money among Treasuries maturing in one, two, three, four, and five years. As each matures, its proceeds can meet spending needs or be reinvested. This spreads maturity dates and reinvestment timing; it does not guarantee a better return than a single purchase. Longer holdings may also appreciate if yields fall, but that potential comes with larger losses if yields rise.
Taxes matter, especially for California readers. Interest from Treasury notes and bonds is subject to federal income tax but exempt from state and local income taxes. TreasuryDirect provides the tax guidance. Do not automatically extend that interest exemption to capital gains or every distribution from a Treasury fund; those require their own tax and fund reporting review.
The price of giving up growth
Replacing stocks with Treasuries can reduce some risks while lowering expected long-run growth. Stocks represent ownership in businesses with uncertain earnings and potential growth; a nominal Treasury promises specified payments. The higher expected reward for stock-market risk does not guarantee stocks will outperform over your particular holding period. Investor.gov's asset-allocation guide connects that trade-off to time horizon and risk tolerance.
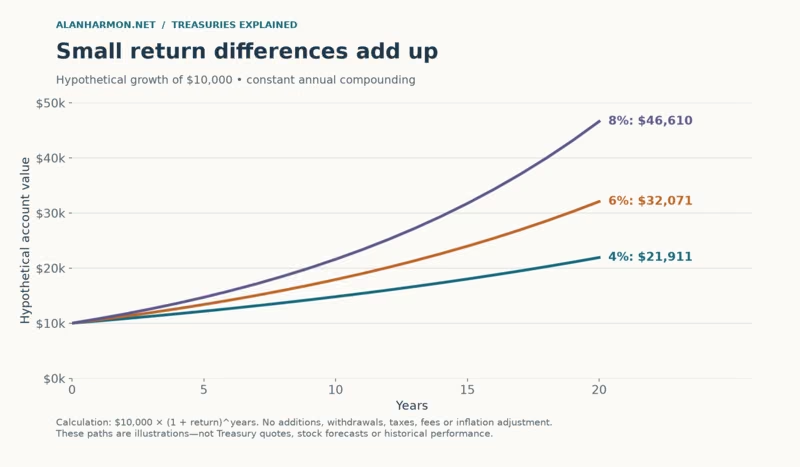
The chart illustrates compounding alone: $10,000 growing for 20 years at constant 4%, 6%, or 8% returns, with no additions, withdrawals, taxes, or fees. The ending values are about $21,911, $32,071, and $46,610. These are neither current Treasury quotes nor forecasts for stocks. Real stock returns are uneven and losses can occur.
Inflation can steadily erode fixed payments. Locking a yield may feel disappointing if better opportunities appear later; choosing a short maturity may disappoint if reinvestment rates fall. The wrong maturity for a spending need can force an early sale. A higher nominal yield alone therefore says little about the eventual after-tax, inflation-adjusted result.
The compounding trade-off
Questions worth asking before buying
Can I lose money in Treasuries? Yes. Selling below your purchase price can cause a loss, and inflation can reduce purchasing power even when every payment arrives.
Does a bond fund mature like an individual Treasury? Most ongoing funds replace holdings to maintain their investment exposure. They do not promise to return your particular investment amount at a chosen maturity date. A fund's share price, fees, and changing holdings matter.
Is the highest coupon the best deal? No. Purchase price and yield matter too. Between coupon dates, a buyer generally pays accrued interest to compensate the seller for interest earned since the last payment. Compare settlement costs and yields, not the coupon alone.
What if inflation is my main concern? Treasury Inflation-Protected Securities, or TIPS, adjust principal with inflation. Their real yields differ from nominal Treasury yields, and their market prices can fall when real yields rise. They are marketable securities, distinct from I Bonds.
Should I wait for the highest yield? The peak becomes obvious only afterward. Maturity matching and a ladder can reduce dependence on one purchase date without guaranteeing better results.
Are Treasuries FDIC insured? No. They carry the full faith and credit of the U.S. government; that is different from bank deposit insurance. The FDIC explicitly distinguishes the two.
Start with the job the money needs to do
The practical question is: What is this money meant to do, and when will it be needed? A Treasury maturity that fits a planned expense can serve a different purpose from money invested for decades of growth. Today's yield helps frame the choice, but the payment schedule, price sensitivity, inflation exposure, and need for growth determine whether it fits.
This article is educational and is not individualized investment or tax advice.