



Brent, WTI, and Murban: Oil Prices, Global Reserves, and What a Longer Iran War Could Mean

A sourced guide to crude benchmarks, dated prices, production and shipping, stored oil versus proved reserves, peak-oil predictions, and conditional scenarios for a prolonged Iran war.
When the news says oil is above $100 a barrel, which oil does it mean? A barrel waiting in Oklahoma is not the same commercial proposition as a cargo loading in the North Sea or on the coast of the United Arab Emirates. The liquid, the delivery point, and the route to the refinery all matter.
Brent, West Texas Intermediate, and Murban offer three useful windows into that market. They are selected examples, not the only benchmarks or an official top-three ranking. Prices here are in U.S. dollars per barrel, with one petroleum barrel equal to 42 U.S. gallons.
A crude grade describes physical oil. A benchmark supplies a reference price against which other barrels can be negotiated. A futures contract adds a specified delivery period and exchange rules; a spot assessment describes the nearby physical market. News reports often switch between them without explaining the distinction.
The larger lesson is simple: the world can have enormous quantities of oil underground and still struggle to deliver enough usable barrels this month. Oil prices respond to both facts, on very different timescales.
Where Brent, WTI and Murban connect to the market
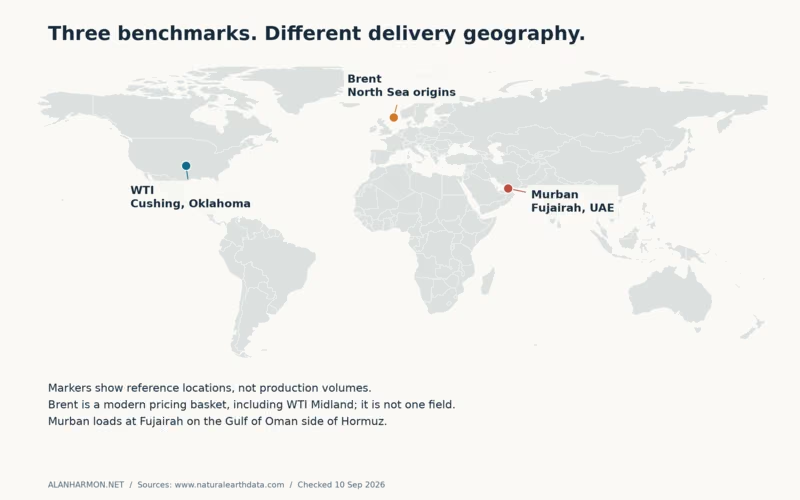
Meet Brent, WTI, and Murban
| Benchmark | Origin and delivery reference | Crude characteristics | Market role and price source |
|---|---|---|---|
| Brent | North Sea origins; a modern basket and connected physical and financial markets | Light crude grades; the basket does not have one immutable field specification | International pricing reference. EIA publishes Europe Brent spot prices; ICE lists Brent futures. |
| WTI | West Texas Intermediate; Cushing, Oklahoma is the principal U.S. contract delivery reference | Light, low-sulfur crude, subject to delivery specifications | U.S. pricing and hedging, connected by pipelines and exports to world markets. EIA spot series; NYMEX futures. |
| Murban | Abu Dhabi onshore production; ICE contract delivery at ADNOC’s Fujairah terminal | ADNOC lists approximately 40° API gravity and 0.778% sulfur | A physical UAE grade and an Asian-market hedging reference. ICE Futures Abu Dhabi is the exchange source. |
Light versus heavy describes density: a higher API gravity means a lighter crude. Sweet versus sour describes sulfur content, although commercial labels and thresholds vary. ADNOC markets Murban as light sweet; that does not mean its sulfur content matches WTI. Refiners care about the actual assay, their equipment, and the products they can sell.
Brent no longer means barrels from one original field. WTI Midland joined its pricing basket with June 2023 cargo deliveries. Murban’s futures contract, meanwhile, specifies physical loading at Fujairah. Dubai/Oman is another important Middle East-to-Asia pricing reference, especially for regional sour crude trade. A higher price is therefore not a universal quality score. It can reflect freight, availability, or the needs of a particular refinery. Sources: ICE on Brent, Murban contract specifications, and ADNOC products.
A dated price check, not a live ticker
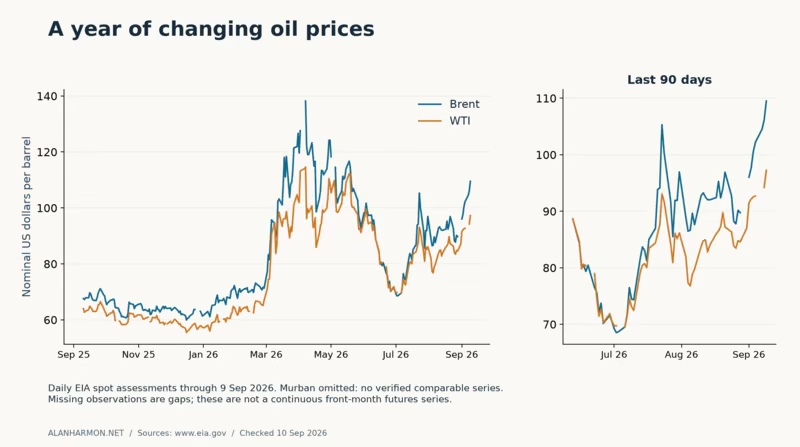
Checked September 10, 2026. The following comparison uses EIA’s September 9 daily closing spot observations, released September 10. EIA supplies observation dates here, not a common clock time or timezone. These are not September 10 intraday futures quotes.
| Benchmark | USD/barrel | Instrument and observation | One-month change | One-year change |
|---|---|---|---|---|
| Brent | $109.51 | Europe Brent spot; September 9, 2026; contract month not applicable | +25.0% | +61.1% |
| WTI | $97.26 | Cushing WTI spot; September 9, 2026; contract month not applicable | +21.9% | +54.5% |
| Murban | Comparable quote not verified | Public futures feeds did not establish a reliable common contract/time basis | Not calculated | Not calculated |
The changes compare September 9 with August 7, 2026, and September 9, 2025. August 9 fell on a weekend, so the monthly comparison uses the latest preceding date with both observations. Percentage change is the latest price divided by the earlier price, minus one. Spot series require no futures-contract roll adjustment.
The same-date Brent–WTI difference was $12.25 per barrel. A Murban spread would require more evidence: a delayed continuous-futures symbol without an identified contract month is not an equivalent physical spot observation. No ADNOC monthly selling price has been substituted. Source: EIA daily spot prices and historical downloads.
Recent Brent and WTI spot prices
Why the prices pull apart
Imagine two refineries bidding for oil. One can receive a nearby pipeline shipment immediately; the other must secure a tanker, insurance, and passage through a threatened waterway. Even similar crude can command different prices because the cost and reliability of delivery differ.
Quality adds another layer. A refinery equipped to process heavier, higher-sulfur crude may value a discounted barrel differently from a simpler refinery. Storage congestion can depress prices at an inland hub. Export access can narrow that discount. Sanctions can restrict eligible buyers, increase transaction costs, and redirect cargoes. A disruption can also increase demand for substitute grades that remain accessible.
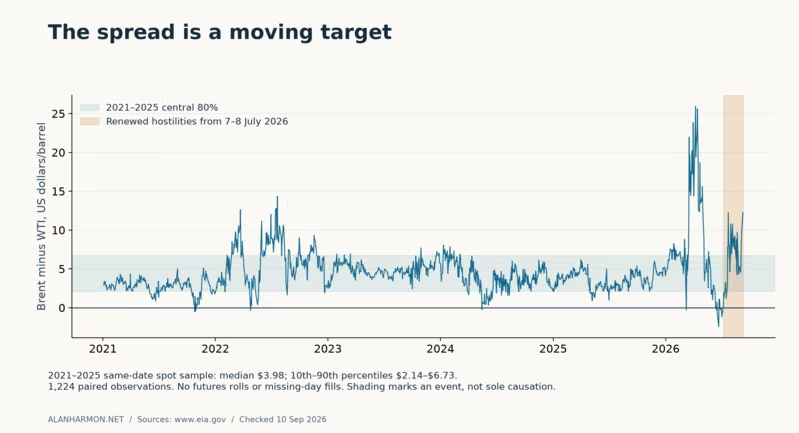
For historical context, I calculated Brent minus WTI for 1,224 paired daily spot observations from January 4, 2021, through December 31, 2025. The median was about $3.98; the middle 80% of observations lay between $2.14 and $6.73. This is a descriptive sample, not a permanent fair-value band. The September 9 premium was well above it.
Brent need not always exceed WTI. Relative demand, logistics, and local shortages can reverse the relationship, as the spread chart shows. The July 2026 shading identifies renewed hostilities described by the IEA; it does not claim that every price movement inside it had one cause. Murban’s relative value is discussed qualitatively because a reliable overlapping series was not established. Sources: EIA data and IEA’s July report.
Brent minus WTI: recent history
Twenty-six years of booms, shocks, and recoveries
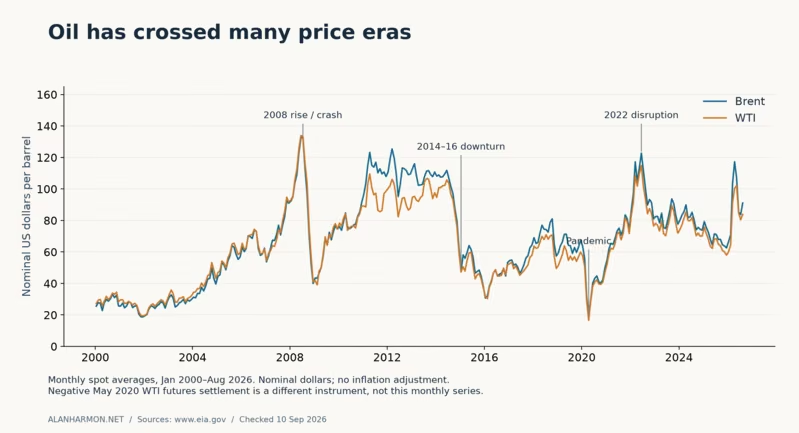
The long-run chart is a reminder that oil has never followed a smooth path. The 2000s rise culminated in the 2008 price surge, followed by the financial crisis and a sharp reversal. Growth in demand, available production, spare capacity, and financial conditions all contributed; a single headline does not explain the whole cycle.
During 2014–2016, expanding supply, including U.S. shale production, met a less supportive demand outlook and changing producer policy. Prices fell sharply. EIA’s contemporary 2014 market review describes both supply growth and demand concerns. That episode helps explain why large reserves do not guarantee attractive prices for their owners.
The pandemic brought another kind of shock: a sudden collapse in transportation demand and intense storage pressure. On April 20, 2020, the expiring May WTI futures contract settled at minus $37.63. That was a specific delivery obligation at a specific moment. It did not mean every barrel worldwide, gasoline at the pump, or the monthly Brent average had a negative price. The CFTC identifies the contract and settlement.
The chart also captures the 2022 disruption and the renewed turbulence of 2026. Its lines are monthly spot averages in nominal dollars, ending in August 2026. Monthly averages smooth daily extremes; inflation also means that the same dollar number in 2000 and 2026 does not represent the same purchasing power.
Brent and WTI since 2000
Production is a flow—and routes decide where it goes
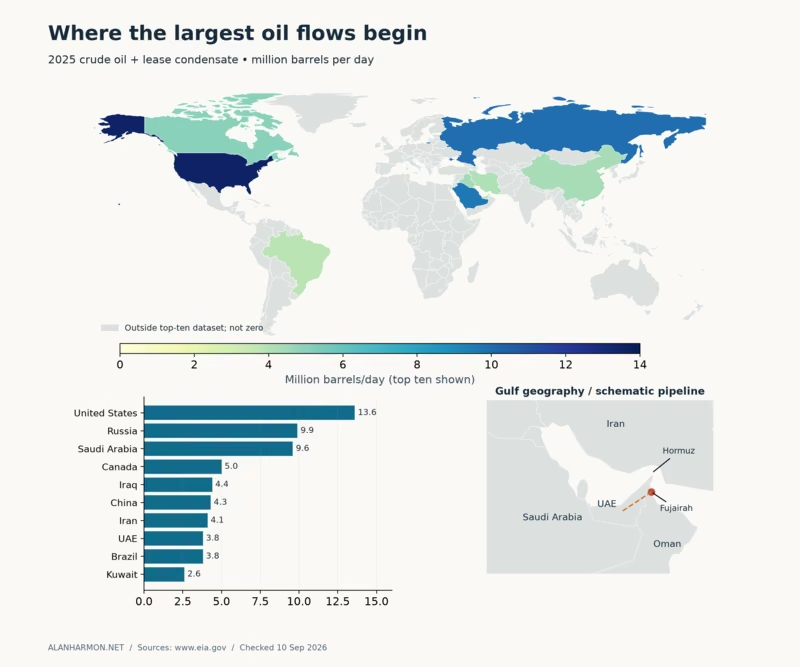
For a consistent country comparison, the production graphic uses EIA’s July 2026 snapshot of 2025 crude oil and lease-condensate production. The United States led at approximately 13.6 million barrels a day, followed by Russia at 9.9 and Saudi Arabia at 9.6. Canada, Iraq, China, Iran, the UAE, Brazil, and Kuwait complete that top ten. These figures are rounded annual averages, not current wartime output.
Production is not exports: a large producer may consume much of its output at home. Nor is it reserves: production measures barrels per day, while reserves measure a stock underground. This crude-and-condensate ranking also excludes the additional liquids counted in broader petroleum supply totals. Source: EIA’s 2025 producer comparison.
Hormuz matters because so much Gulf oil normally uses one narrow exit. In its June 2025 baseline analysis, EIA estimated flows of about 20 million barrels a day in 2024. Alternative routes help, but their capacity is not all unused. EIA described a UAE pipeline rated at 1.8 million barrels a day connecting onshore fields with Fujairah on the Gulf of Oman. Saudi Arabia’s East–West pipeline reaches Yanbu on the Red Sea. Those are infrastructure descriptions, not guarantees of present throughput.
Fujairah offers a route around Hormuz, not immunity from attacks, terminal constraints, or insurance problems. EIA’s chokepoint analysis explicitly distinguishes pipeline capacity from spare rerouting capacity. September reporting shows why that distinction remains essential.
Largest oil producers and Gulf export geography
How much oil is already in storage?
“Global reserves” can mean two different things. Start with oil already above ground. Government emergency stocks are held for supply disruptions. Commercial inventories support refinery operations, distribution, and trading. Oil on water includes cargoes in transit and floating storage, where observed. These categories must be defined before totals can be compared.
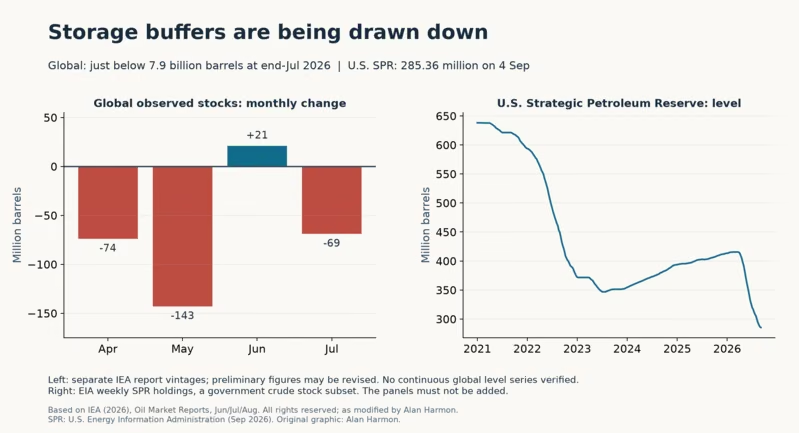
The latest IEA report verified for this draft, its August 2026 edition, placed observed global stocks just below 7.9 billion barrels at the end of July. July’s estimated decline was 69 million barrels. “Observed” matters: this is an estimated inventory measure with reporting lags, not an exact live count of every tank. Source: IEA August Oil Market Report.
EIA’s weekly series puts the U.S. Strategic Petroleum Reserve at 285.36 million barrels on September 4, 2026. That is government-held crude, not all U.S. oil inventories and not an amount to add to the global estimate. OECD commercial stocks are another distinct subset. A sufficiently current, verified IEA commercial-stock total was not available in the public material consulted, so no worldwide figure is inferred from it. Source: EIA weekly SPR holdings.
A barrel in storage is useful only if it can reach the right refinery or buyer at the required rate. Location, crude quality, product mix, terminal capacity, and release schedules all matter. Dividing a stock estimate by daily consumption may produce a rough coverage ratio, but never a reliable date when the world “runs out.”
Global stock changes and U.S. SPR holdings
How much remains underground?
Proved reserves are quantities judged recoverable with reasonable certainty under specified economic and operating conditions. Technically recoverable resources extend beyond what is currently economic or established as proved. Oil in place includes material that may never be extracted. These categories overlap; adding them would double-count oil.
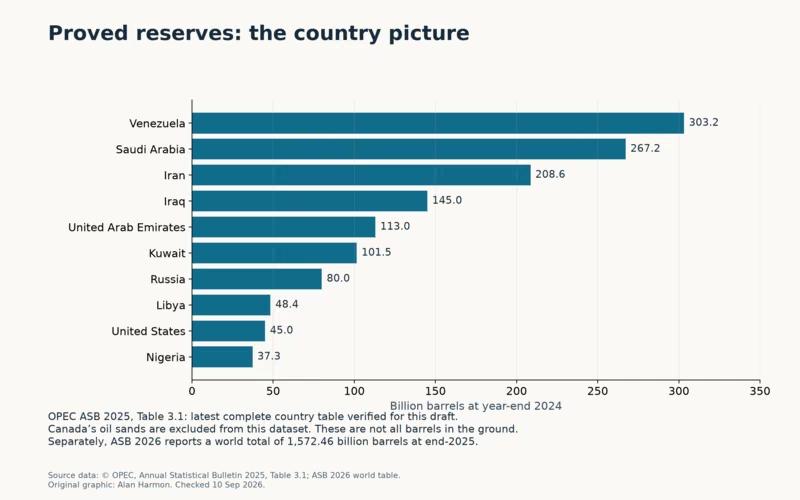
OPEC’s 2026 Annual Statistical Bulletin reports approximately 1,572.46 billion barrels of world proved crude oil reserves at year-end 2025. That annual estimate is not a real-time September reading. The accompanying country chart uses the latest complete country table verified for this draft: Table 3.1 of ASB 2025, representing end-2024. Its leaders are Venezuela, Saudi Arabia, Iran, Iraq, and the UAE. The different years are labeled rather than blended. Sources: ASB 2026 world table and ASB 2025 country table.
Coverage makes a large difference: that country table excludes Canadian oil sands. OPEC’s crude definition includes qualifying heavy and extra-heavy oil and some liquids recovered in lease separators; it is not a total for every petroleum liquid. Rankings using broader Canadian oil-sands reserves can therefore look very different. See OPEC’s definitions.
Reserves can rise while wells keep producing. Discoveries, better recovery, revised estimates, and higher economic recoverability can add booked barrels. Conversely, a huge resource can coexist with weak production because development requires investment, equipment, infrastructure, and stable operating conditions. Underground abundance tells us little about next week’s deliverable supply.
Top ten proved crude oil reserves, end-2024
Why the Peak-Oil Story Changed
Some prominent mid-2000s warnings were much more specific than today’s readers might remember. NJIT’s announcement for Kenneth Deffeyes’s September 19, 2005 lecture said he expected world oil production to peak around Thanksgiving 2005. Lester Brown’s November 15, 2007 essay argued a global peak was possible and treated the United States as already past its peak. Those were identifiable arguments, not a unanimous verdict by “the scientists.” Sources: NJIT’s contemporary lecture announcement and Brown’s original essay.
Definitions matter when testing them. A peak in conventional crude is not necessarily a peak in crude plus condensate, all liquids, or energy available from every source. The short lecture announcement does not establish a fully reproducible production category. It should not be used to claim that Deffeyes predicted the immediate disappearance of all oil.
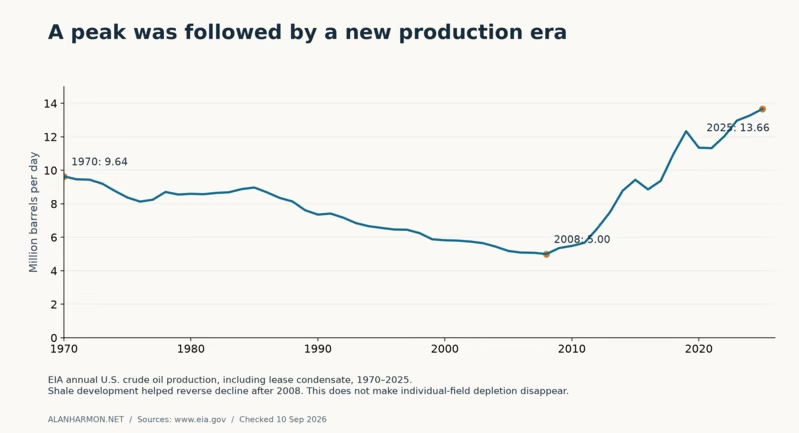
The U.S. record nevertheless demonstrates how assumptions can fail. EIA’s consistent domestic series shows production falling from 9.637 million barrels a day in 1970 to 5.000 million in 2008, then climbing to 13.662 million in 2025. Horizontal drilling, hydraulic fracturing, and improved operations unlocked tight formations on a scale that transformed the trajectory. Deepwater developments, oil sands, recovery improvements, prices, and investment also expanded supply options, although their contributions differed by country.
Depletion did not disappear. IEA’s field-level study finds an average observed post-peak decline of 5.6% a year for conventional oil fields. New investment must offset declines before total supply grows. And a future demand peak driven by efficiency, electrification, or substitution is a different mechanism from a geologically constrained supply peak. Sources: EIA production history, EIA on shale growth, and IEA field-decline analysis.
U.S. crude production since 1970
What if the U.S.–Iran war continues?
Conditional outlook, September 10, 2026. Reuters reporting dated September 9 described a new wave of tanker attacks, including Iranian claims of attacks near Hormuz following U.S. strikes on Iranian tankers. AP’s September 10 reporting also described threats to Red Sea shipping. These reports support continued disruption risk; they do not provide an audited, live count of barrels moving through each route. Sources: Reuters report and AP on Red Sea risks.
| Scenario | Next 1–3 months | Next 6–12 months and what changes it |
|---|---|---|
| Conflict persists; substantial exports continue | Assuming intermittent disruption without lasting major damage, volatile prices and a risk premium remain plausible. | Restored shipping and inventory rebuilding could ease prices; renewed losses or stronger demand would work against that. |
| Sustained export-capacity losses | Prolonged route restrictions or infrastructure damage put greater upward pressure on prices; temporary spikes and wider regional spreads become more plausible. | Repair times and accessible replacement supply dominate. Reserve releases help bridge losses but cannot indefinitely replace a large missing flow. |
| De-escalation and gradual recovery | Better access and insurance can reduce the risk premium, even before all facilities restart. | Recovering production and inventories favor lower prices, provided repairs proceed and renewed attacks do not interrupt them. |
My base case is continued near-term volatility with recovery dependent on actual cargo movement. I would not assume a smooth decline after the latest attacks. Over six to twelve months, sustained improvements in shipping and production would make easing more plausible. This judgment carries no invented probabilities or precise price target.
For comparison, EIA’s September 9 forecast projects Brent averaging roughly $90 in the second half of 2026 and $74 in 2027. Its inputs closed September 3, before the latest reported escalation. Those are period averages under a recovery assumption, not promised daily prices. Strategic releases, non-Gulf output, accessible spare capacity, and weaker demand can offset losses; new drilling and major repairs take time. Spare capacity behind a blocked route is not immediately usable. Source: EIA September outlook.
Five signals worth watching
The most useful follow-up is to watch the physical market alongside the headlines:
- Export and shipping flows: sustained increases in completed loadings and safe transits would support recovery; announcements alone are weaker evidence.
- Inventories: continued draws suggest buffers are absorbing a shortfall. Broad, sustained builds would ease that pressure, subject to location and product mix.
- Accessible production and spare capacity: count barrels that can reach customers, not just wells that could theoretically pump more.
- Benchmark spreads: widening differences can reveal regional shortages or transport constraints; narrowing can indicate improved connections.
- Demand and refinery activity: weaker fuel use can relieve crude pressure, while damaged or constrained refineries can leave gasoline, diesel, or jet fuel tight even when crude becomes available.
Brent, WTI, and Murban help answer different parts of the same question: which barrels can reach which buyers, at what cost, and when? There is no contradiction between having a great deal of oil left underground and facing expensive, unreliable deliveries today. Keeping those two timescales separate makes both the reserve numbers and the daily price headlines much easier to understand.